
12 month demand plan
A rolling 12 month plan per product, computed from your own forecast where you enter one, or an automatic baseline: the average of the last three months that actually sold, excluding any month the product was out of stock.
Axion builds a 12 month demand plan from your own sales, watches each brand's stock cover against its own policy, and turns a warning into a purchase order with the supplier's lead time already worked in. From receiving through picking and dispatch to a signed proof of delivery, the same data feeds a monthly scorecard of the numbers a supply chain manager checks, including OTIF and demand plan accuracy.
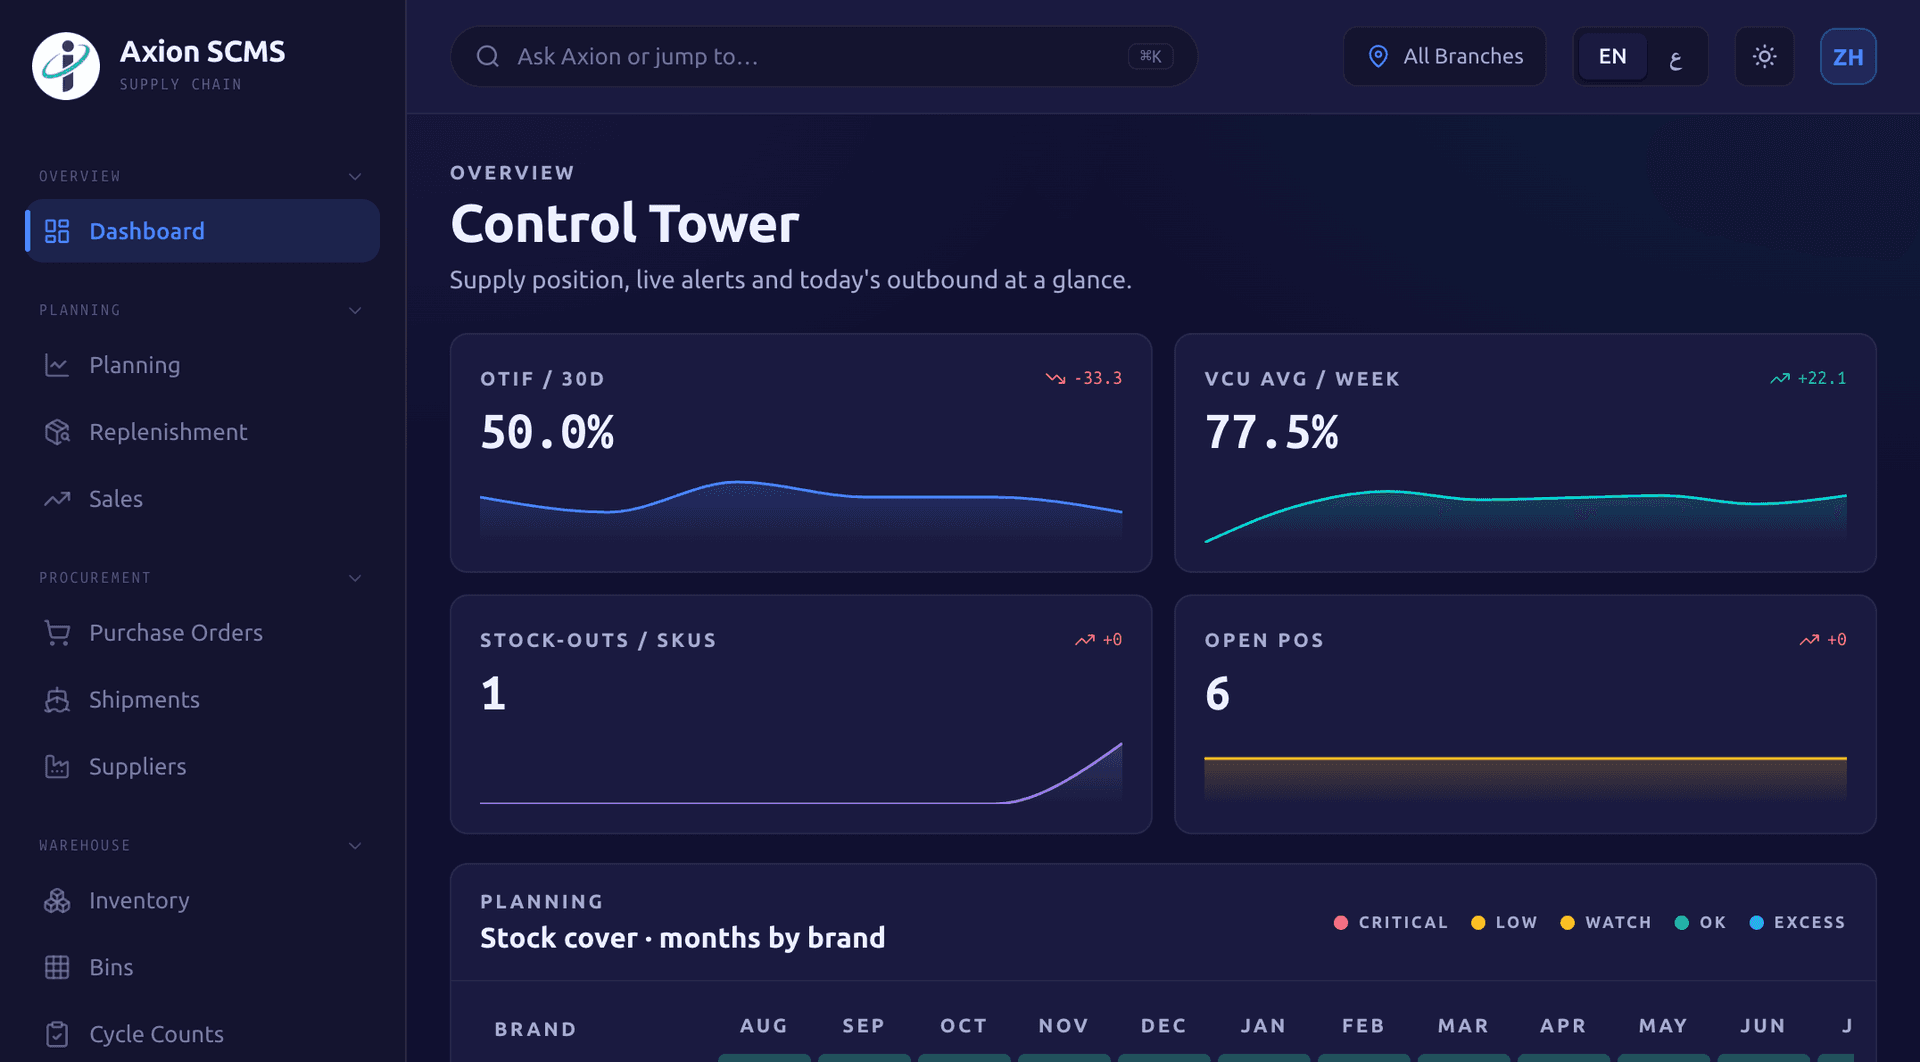
A rolling plan of what you will need, built from what actually sold.
A rolling 12 month plan per product, computed from your own forecast where you enter one, or an automatic baseline: the average of the last three months that actually sold, excluding any month the product was out of stock.
Open purchase orders and inbound shipments are combined into the plan without counting a shipment and its own purchase order twice.
Each brand's months of cover against its own minimum, warning and maximum policy, graded red, amber, green or blue by month.
Realised sales by branch, product and brand feed the demand plan's baseline, with Excel import and export.
Enter a forecast per product and month while its window is open. Any month you leave blank falls back to the automatic baseline, and an elapsed month is always overwritten with what actually sold.
From a stock cover warning to a purchase order, in the supplier's own lead time.
Axion flags the first month a brand's cover falls below its own minimum, works out the quantity to bring it back, rounds that to the supplier's minimum order and pack size, and sets the order date back by the supplier's lead time. Approve a recommendation into a draft requisition, or dismiss it with a reason.
A draft to approve workflow that a replenishment approval or a manual request feeds into.
Draft, submit, approve and send. A sent order goes out by automatic email, as a fillable supplier form, or through a supplier portal.
Each supplier carries its own lead time and minimum order quantity, which drive the replenishment date and quantity directly.
Each brand keeps its own minimum, warning and maximum months of cover, the policy behind the heatmap and the replenishment trigger.
Stock by warehouse and batch, counted and moved with a full record.
On hand quantities by product, warehouse and batch, with a full movement ledger and snapshot import and export.
Receiving, pick face, bulk, staging, quarantine and damage bins, each doing a different job in the warehouse.
Create a count, add its lines, record the physical count, then approve or cancel. Approved lines feed the inventory accuracy KPI.
A pick list is assigned to a picker, and each task resolves to picked in full, or short if it is not, then moves to pack.
Each shipment moves from planned through confirmed, in transit and arrived, on the way to receiving. Its required delivery date can be changed, and every change is kept as a full history: a later change never resets the on time clock behind the supplier scorecard.
A queue of shipments still open for receipt, with barcode search, and quantities posted against the original purchase order.
Move stock from one warehouse to another, and put newly received stock away into its bin.
Stock with no movement in 90 days, tracked apart from stock ageing in five buckets by age and separately by expiry.
From the dispatch board to a signed delivery, with the fuel and damage numbers behind it.
Each delivery order carries the quantity ordered and delivered per line, and can be cancelled. Units delivered against units ordered, across your delivery orders, is what the customer order fulfilment figure on the KPI scorecard measures.
Unassigned delivery orders alongside your vehicles, drivers and today's trips, with a warning when the same driver would get a far-region trip on consecutive days.
Propose trips from pending delivery orders by vehicle capacity, set the stop order, then start, complete and follow live positions.
Drivers capture a signature and photos at each stop, with GPS positions checked against the trip.
Litres, cost and odometer reading per fill, rolled up into kilometres per litre for the fleet.
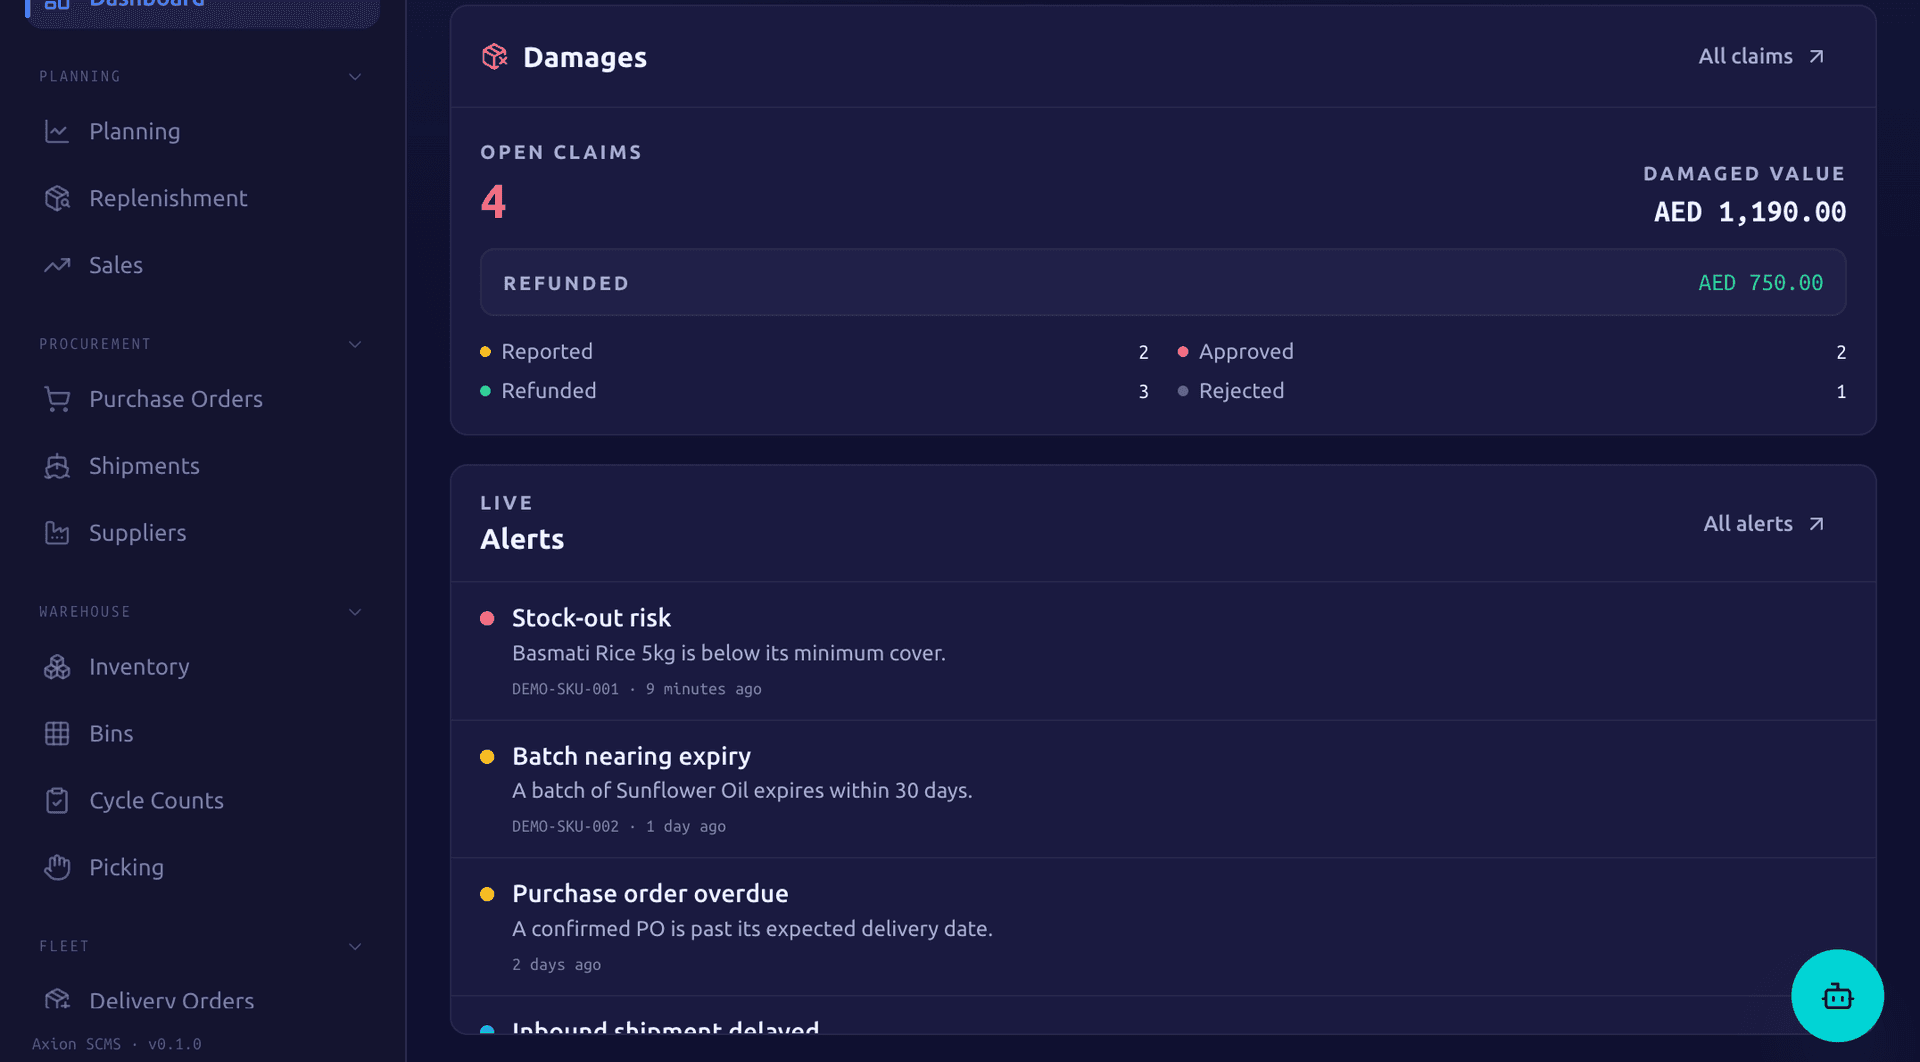
A claim moves from reported to approved or rejected, then marked refunded, tied to the delivery order line it came from.
Storage, demurrage, CLT and other categories, summarised with Excel import and export.
On time in full percentage against each shipment's original required date, plus the average delay in days and how often that date moved, grouped per supplier.
The numbers a supply chain manager checks every month, generated for you.
Fourteen KPIs every month, from demand plan accuracy and forecast bias to OTIF, vehicle capacity utilisation (VCU) and stock variance, each graded green, amber or red against its target.
Three alert types scanned every 30 minutes: stockout risk, expiry and shipment delay. An alert clears itself once the condition it flagged is resolved, and you can also acknowledge or resolve one by hand.
An audit log of business changes, with sensitive fields redacted, viewable per record or across the whole box.
Three dedicated reports, product catalogue, stock levels and the low stock reorder worklist, in PDF or Excel, plus Excel import and export on the main lists.
Fourteen KPIs, each with its formula and a target, graded green, amber or red every month.
| KPI | What it measures | Target (green) | Amber |
|---|---|---|---|
| Customer order fulfilment | Units delivered as a percentage of units ordered | 85% | 75% |
| Demand plan accuracy | 100 less the average percentage error between your forecast and actual sales | 70% | 55% |
| Forecast bias | The gap between forecast and actual, divided by actual, so a positive figure means the forecast ran high and a negative figure means it ran low | Within 10% either way | Within 25% either way |
| Inventory accuracy | 100 less the counted variance as a percentage of the quantity the system expected, from approved cycle counts | 95% | 90% |
| Picking accuracy | Units picked in full as a percentage of units picked in full plus units picked short | 98% | 95% |
| On time in full | Delivery stops completed on the day the trip called for, as a percentage of all stops | 95% | 85% |
| Proof of delivery compliance | Delivered stops with a captured signature, as a percentage of all delivered stops | 95% | 85% |
| Damage rate | Damaged units as a percentage of delivered units, where lower is better | 2% or under | 5% or under |
| Fuel efficiency | Kilometres travelled per litre of fuel, from the distance between odometer readings | 10 km per litre or more | 7 km per litre or more |
| Vehicle capacity utilisation (VCU) | How full each trip ran, taking the higher of weight and volume against the vehicle's capacity, averaged across the fleet | 80% or more | 60% or more |
| Order cycle time | Average hours from order to delivery | 24 hours or under | 48 hours or under |
| Average stock cover | Average days of cover across your products, where lower means less cash tied up in stock | 45 days or under | 75 days or under |
| Warehouse capacity utilisation | Stock on hand as a percentage of capacity, for warehouses with a capacity set | 85% or more | 65% or more |
| Stock variance and expiry loss | The value of expired stock plus cycle count variances, as a percentage of total stock value | 2% or under | 5% or under |
Transport cost per delivered unit also appears on the scorecard, as an informational figure with no fixed target.
Set the plan once a month, then let a cover warning carry through to the warehouse door.
Demand plan
Axion builds the 12 month plan per product from your forecast, or the trailing three month sell through average, and works out each month's stock cover.
Replenishment recommendation
The first month a brand's cover falls below its own minimum triggers a recommendation, with the quantity, order date and supplier already worked out.
Approve into a requisition
Approve the recommendation into a draft purchase requisition, or dismiss it with a reason.
Purchase order
The requisition becomes a purchase order: submit it, approve it, then send it to the supplier by automatic email, a fillable form, or a portal.
Receiving
When the shipment arrives, receive it from the barcode search queue and post the actual quantities against the original order.
Scanned every 30 minutes, and cleared automatically once the condition is resolved.
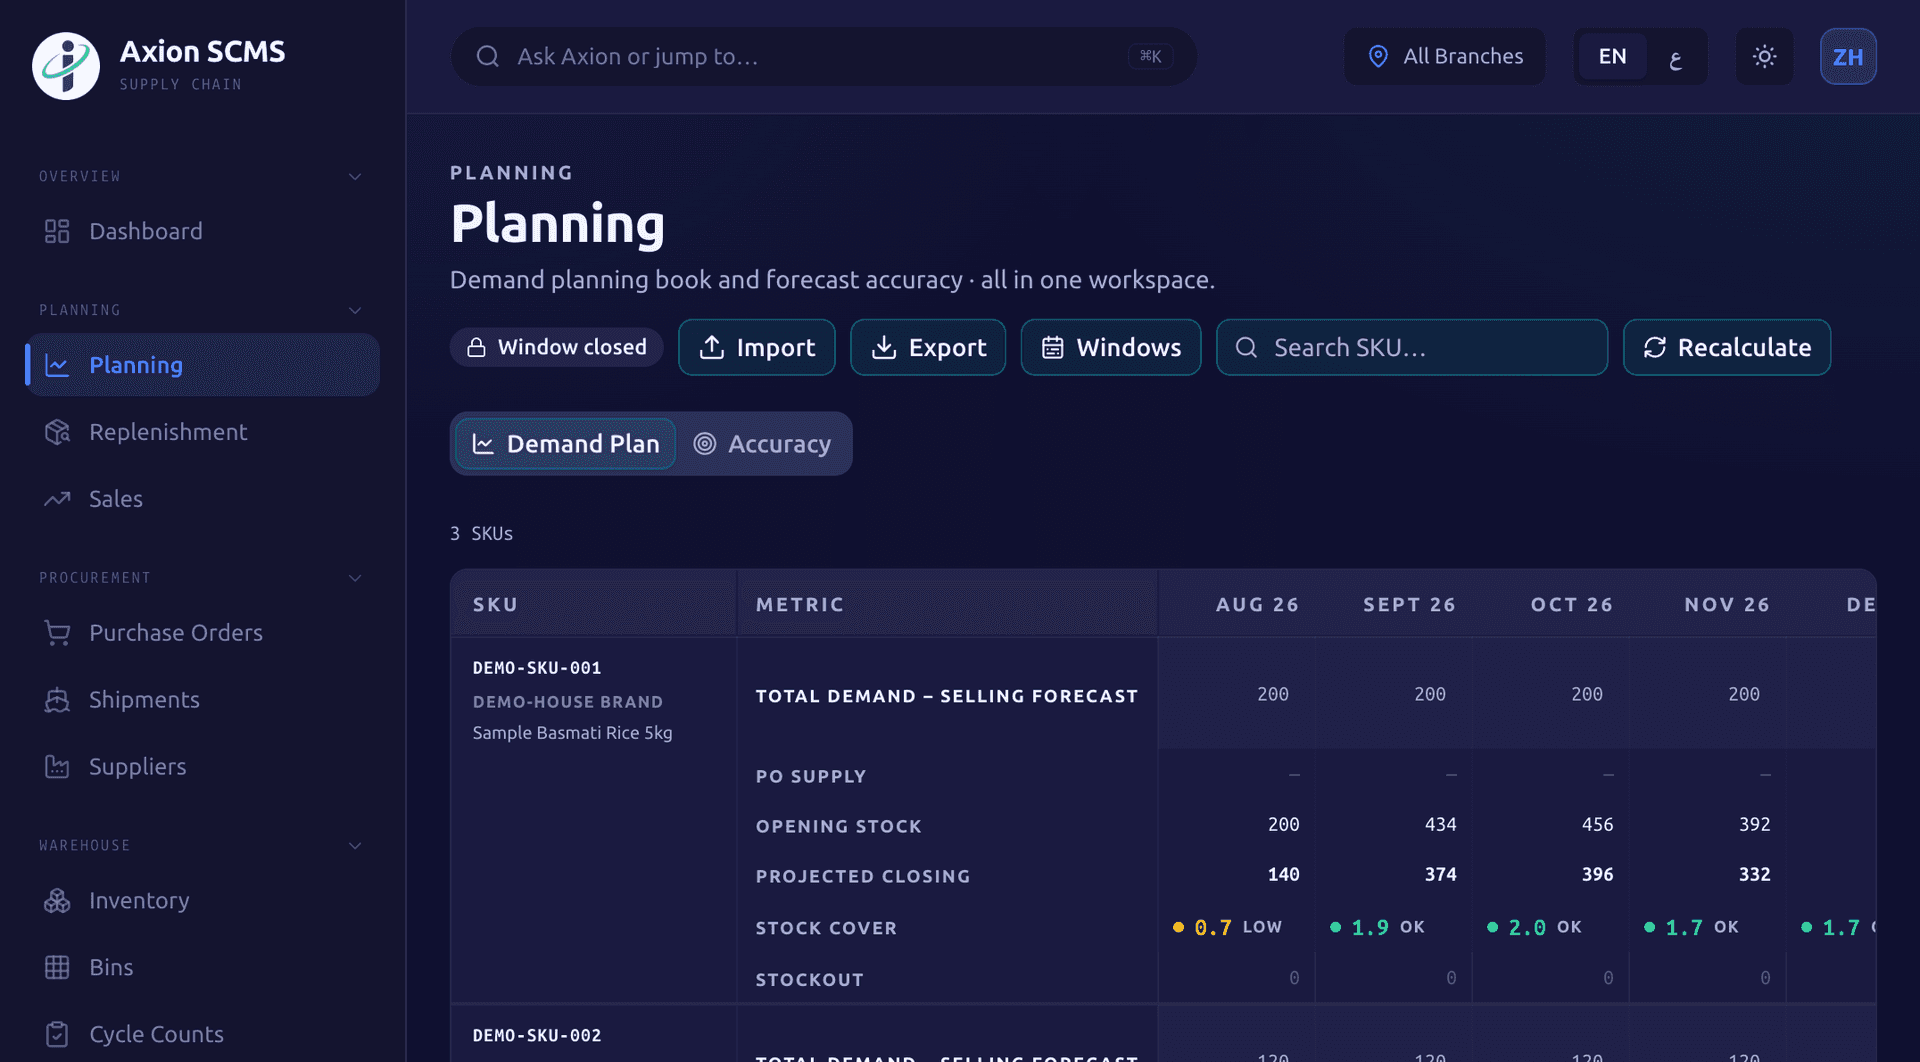
From your own forecast, entered per product and month while the forecast window is open, or uploaded from Excel. Any month you leave blank falls back to an automatic baseline: the average of the last three months that actually sold, leaving out months the product was out of stock. Elapsed months are replaced with what actually sold, and demand plan accuracy and forecast bias measure how close the forecast came.
Each brand sets its own minimum months of cover. Axion finds the first month in the plan that falls below it, works out the quantity that restores the cover, rounds it to the supplier's minimum order and pack size, and sets the order date back by the supplier's lead time, never into the past.
At each stop, the driver captures a signature and photos, and Axion checks the GPS position against the trip. Dispatch and trip tracking run in the dashboard, alongside the fuel logs and damage claims tied to the same deliveries.
No. A replenishment recommendation waits for you to approve it into a draft requisition or dismiss it with a reason, and a purchase order is submitted and approved before it is sent. Once approved, it goes to the supplier by automatic email, as a fillable supplier form, or through a supplier portal.
Yes. Suppliers, brands, warehouses, bins, fuel logs, transport costs, sales actuals, forecasts and inventory snapshots each have an Excel template, import and export, so you can load what you already keep in spreadsheets and take it back out again.
Fourteen, each graded green, amber or red against a target every month: customer order fulfilment, demand plan accuracy, forecast bias, inventory accuracy, picking accuracy, on time in full, proof of delivery compliance, damage rate, fuel efficiency, vehicle capacity utilisation (VCU), order cycle time, average stock cover, warehouse capacity utilisation, and stock variance and expiry loss. Transport cost per delivered unit also appears, as an informational figure.
Apply for a 90-day pilot, or book a 30-minute demo and we will walk you through the boxes that fit your business, with your own numbers.
A Novamind product, built for the GCC.